AI-CAD, Sketch-to-Energy
Building Design System
You draw a building; the system tells you what it would cost to run. Seven stages take the sketch through CAD retrieval, depth estimation, single-view 3D reconstruction, voxel massing and an EnergyPlus thermal model, then rank the options on a Pareto front instead of collapsing them into one score. Rebuilt from a stalled client handover into 54 validated modules.
A pipeline that reported success and produced nothing
The brief was a research pipeline that turns an architect's sketch into an energy-simulated building. It existed, in pieces, and it did not run. What I received was a partial handover: seven Python files, a half-exported TensorFlow model, two screen recordings, and a document that turned out to be the most useful thing in the set, a complete run log of the pipeline failing.
Most of the brief assumed the code was unrecoverable and that the system should be rebuilt from a description. Reading the log changed that. The failure was specific, reproducible, and visible in eleven lines:
📋 The failure, from the original run log
Executing step: run_geometry_mod
  Processing complete. Output files saved in ../GeometryModification/casestudyresult/...
  Command completed successfully.                    ← exit code 0

Executing step: process_geometry_mod_output
  Processing Geometry Modification output (if any)...   ← did nothing

Executing step: prepare_energyplus_input
  Error: GM output PLY not found at '..._mesh.ply'
  Workflow stopped due to a critical failure in a previous step.
A stage printed “Processing complete”, exited cleanly and wrote no file. The pipeline then carried on for two more stages before anything noticed. That gap between reported success and actual success is the whole problem, and it is not unique to this project.
Four faults, conspiring
The missing file was the symptom. Four independent design decisions had to line up for it to go unnoticed for three stages:
Silent no-op
The geometry stage hit a degenerate face, logged invalid value encountered in divide, and continued to its success message without writing output.
Exit codes trusted
The orchestrator ran stages through shell=True and never checked what came back. A zero exit code was treated as proof of work.
Filenames rebuilt by hand
Each consumer reconstructed the expected filename from scratch, in five places with three different directory prefixes. A correct file under a slightly different name would still have been missed.
Relative-path muddle
A stage ran with its working directory set to a folder, and an output path that went up and back into the same folder.
🎯 The rule the rebuild is organised around
Every stage declares its outputs, writes only to paths issued centrally, and validates them before reporting success. One module owns every filename in the system; a helper asserts the file exists and is non-empty before a stage may return. The original failure is now impossible to express: a stage that writes nothing raises inside itself, naming the file it owed.
Seven stages, two backends each
The research assets the pipeline depended on, a trained retrieval model, a single-view reconstruction network, an EnergyPlus install, were either missing or unavailable. Waiting for them would have meant delivering nothing testable. So every stage carries two implementations behind one interface:
The fallbacks need nothing beyond NumPy, Pillow and trimesh, so the complete pipeline runs on any laptop. Selecting a backend is one line of configuration, and a --mode research flag forces the real implementations and fails loudly if any is absent, because silently substituting an approximation is how unpublishable numbers get published.
🏗 What the geometry stage actually does
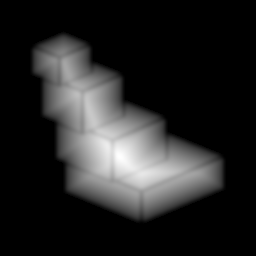
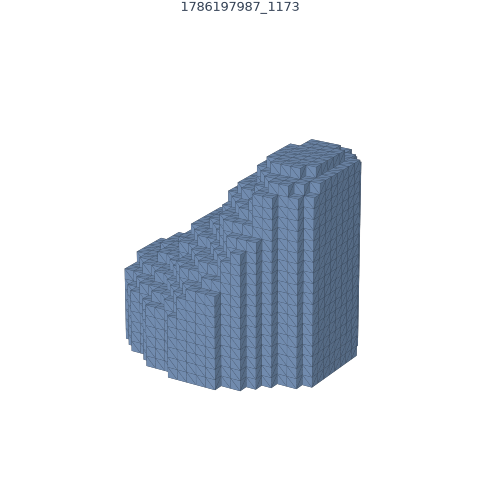
Orient to Z-up, align the plan's principal axis, scale to a real target size in metres, voxelise, extend every occupied column to ground so the mass rests on grade, re-surface, and measure. Storey footprints are traced with crack-following so L-, U- and cross-shaped plans survive, then rationalised with Douglas–Peucker to collapse the one-cell staircases voxelisation leaves on diagonal walls, which cut the generated EnergyPlus surfaces from 212 windows to 69 with no loss of fidelity.
Numbers from an actual run
Everything below came from one run on an ordinary CPU-only laptop, with the configuration hash recorded in the run manifest. No GPU, no paid APIs.
🌡 Same building, five climates
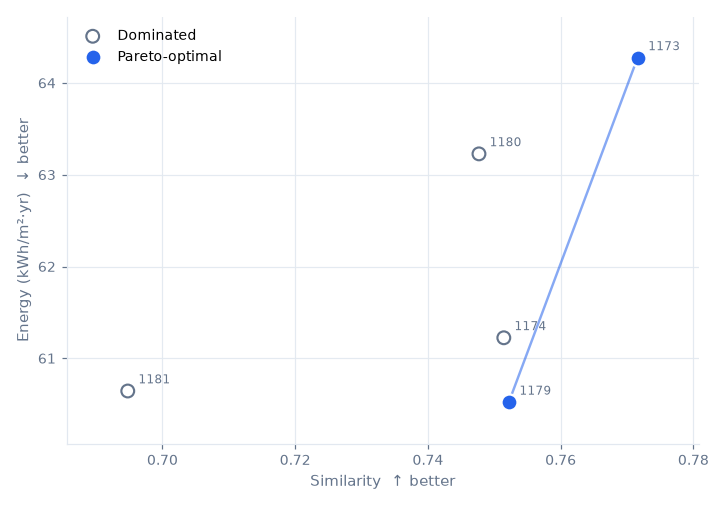
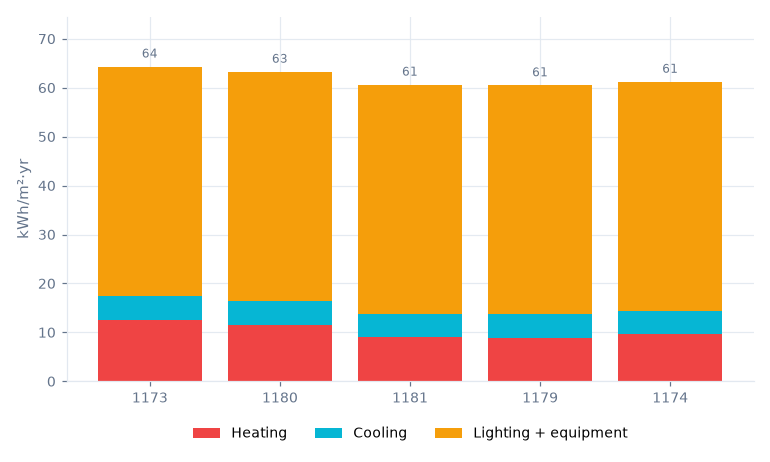
The identical massing evaluated against five climate presets spans 64.3 kWh/m²·yr in London to 122.6 in Dubai, London heating-dominated at 15.6 MWh, Dubai cooling-dominated at 92.9 MWh. It is a small demonstration of the point the whole pipeline exists to make: the “best” massing is not a property of the form alone.
The bug that looked like a working system
Voxelisation originally sampled the mesh surface at random to build a shell, then flood-filled the interior. It passed every visual check. It was also wrong in a way that produced entirely plausible output.
The shell feeds the flood fill, so a single missed voxel opens a channel between outside and inside, the fill escapes, and the “solid” collapses to a hollow shell, with a volume, floor area and energy result that all still look reasonable. Two consecutive voxelisations of the same unit box gave 2,343 and 7,744 voxels.
🔍 How it surfaced
Not from a failing pipeline. From writing an evaluation metric. Intersection-over-union has a known answer when you compare a mesh with itself: exactly 1.0. It came back 0.9987, and it moved between runs. A metric with a ground truth turned an invisible corruption into a two-line reproduction.
The fix replaces random sampling with deterministic barycentric rasterisation. Each triangle is sampled on a lattice finer than half a voxel, which guarantees an unbroken shell and a reproducible result. There is now a regression test, plus a runtime check that compares voxel volume against the analytic mesh volume and warns when a fill has leaked.
The same instinct produced the mesh-validity gate. Voxelisation closes almost any surface, so a badly failed reconstruction still yields believable floor areas. Every mesh is now inspected for watertightness, boundary edges, non-manifold edges and disconnected components, put through a bounded repair pass, re-inspected, and rejected if it still fails. In the run above it caught and repaired non-manifold geometry in 3 of 5 reconstructions.
What these numbers are and are not
Two constraints materially bound what this system has demonstrated, and both are surfaced by the tool itself rather than buried in a footnote.
The dataset is a stand-in
The client's 3,341 hand-classified architectural drawings were never shared. The retrieval metrics are measured on a synthetic database built to match its structure, 12 typologies, same naming, 288 images. They measure the descriptor, not performance on the real corpus.
EnergyPlus has not been executed
No EnergyPlus install was available. The IDF generator, runner, version detection and results parser are complete, and the generated model was inspected object by object, surface winding verified against Newell normals, but no simulation has run. Energy figures come from the screening model and are labelled as estimates in the interface.
Both gaps close with configuration rather than code: point the database path at the real drawings, install EnergyPlus and supply a weather file. The evaluation suite already contains the study that validates the two-tier design once a simulation is available. It reports Spearman rank correlation between the cheap screen and the real run, because screening is sound as long as it ranks correctly, even where the absolute values differ.
🧠 What I would do differently
I would write the evaluation metrics first. The voxelisation bug survived every visual review and every end-to-end run. It took a metric with a known answer to expose it. On a pipeline where each stage produces something that looks plausible whether or not it is correct, a test with a ground truth is worth more than a screenshot.
Tools used
Similar problem?
This project was a rescue: a stalled pipeline, a partial handover, and a failure nobody could locate. If you have a research system that runs but cannot be trusted, or one that has stopped running altogether, that is the work I enjoy most.